Table of Contents

Background
In mid-2017, nearly a year into my first professional role and roughly three months after I took on operational support for the Palo Alto firewall platform under my employer, I was contacted by my manager to develop a geographical asset tracking solution for all our firewalls at all our various sites around both the state of Michigan as well as across the entire country. I was told in advance that a previous employee (who is now my acquaintance) had started working on a custom project to meet these requirements, but due to other commitments and an eventual departure from the company, had never completed the work on their own solution.
I was also told that the specific design decisions and time commitments to the project were to be set entirely at my discretion, as it was deemed a “one-off” project to complete in my spare time (i.e. when not responding to or resolving incident tickets or working on platform upgrades) and did not have an official project task or budget assigned to it.
So after a short while investigating potential avenues to pursue, I ultimately decided to begin with a fresh Node.js application due to its inherent asynchronous efficiency, my strong familiarity with and predilection for JavaScript, and the assumed flexibility a web-based project normally has to offer the developer. I also knew that integrating with the Google Maps API would be feasible via npm, the (N)ode (P)ackage (M)anager, and as a result deserved scrutiny beyond the surface-level planning phase.
Given that the original idea was to plot out sites by geographical location and list all firewall assets at each site in a color-coded fashion based on PanOS version, it made sense to integrate with at least one popular maps API - for this project, I did end up selecting the Google Maps API as it provided all the functionality I needed and because the google-maps npm package was MIT-licensed and well-documented.
Implementation
Before delving too deeply into the technical, I want to note that this project was developed in two separate iterations. The first took place entirely in 2017, and the second occurred in early 2020 as an extension to the first to provide an extra layer of visibility while the company and the world were impacted by the COVID-19 pandemic. It was decided at the executive level that all of IT needed to report additional performance metrics to upper-management on all supported technology across the company. Naturally, this included all networking infrastructure - switches, routers, and in my case, firewalls.
Iteration 1
The first iteration of my “Firewall Version Map” included the installation of several dependencies via npm and documented the beginning of several of my own .js modules. I knew that I would need a way to retrieve data from the firewalls, and I knew I would need to be able to read in latitude and longitude values for the Google Maps markers. Therefore, my initial design included the following modules:
app.js- entry point loader and controller module (node app)snmp.js- handle SNMP requests (snmpget())db.js- handle caching of geolocation dataglobals.js- shared global static variables (community strings, SNMP OIDs, etc.)
I also knew I would need to create a simple frontend for the map and markers, which I placed in ./frontend/ and loaded as a static client content route in app.js via the express dependency. Express is described as a “fast, unopinionated, minimalist web framework” and operates as a web server (similar to Nginx or Apache2, albeit far more lightweight), which I added to app.js:
var express = require('express');
var app = express();

// Port
server.listen(process.env.PORT || 3000);
log('Server running...');

// Main route
app.get('/', function(req, res) {
  res.sendFile(__dirname + '/frontend/index.html');
  log('Client \'/\'');
});

// Static client content route
app.use(express.static(__dirname + '/frontend/public'));

// Connect
io.sockets.on('connection', function(socket) {
  connections.push(socket);
  var ip = address(socket.request.connection.remoteAddress);
  log('Client \'connection\': ' + ip + ' (' + connections.length + ')');
  // Disconnect
  socket.on('disconnect', function(data) {
      connections.splice(connections.indexOf(socket), 1);
      log('Client \'disconnect\': ' + ip  + ' (' + connections.length + ')');
  });
  // When client requests to 'get' data
  socket.on('get', function(data) {
    log('Client \'get\': ' + ip + ' ' + data);
    switch(data) {
      case 'version':
        socket.emit('get_' + data, currentVersion);
        break;
      case 'caches':
        socket.emit('get_' + data, caches);
        break;
      default:
        log('Unknown data requested by client: ' + data);
        break;
    }
  });
  // When client acknowledges it got data
  socket.on('got', function(data) {
    log('Client \'got\': ' + ip + ' ' + data);
  });
});
This code spins up an express server on port 3000 and adds the aforementioned route for the frontend web page content. Basically, this tells the server ./frontend/index.html and everything else in ./frontend/public/ is available to send down to the client browser when new connections make requests against the server.
It also adds event listeners for client connections, disconnects, and firewall data requests via socket.io, another npm package that enables real-time bidirectional event-based communication. For iteration 1, I only needed to support data requests for the version (to compare asset version against expected version) and caches (longitude and latitude values).
To actually retrieve data from the firewalls, I used the (S)imple (N)etwork (M)anagement (P)rotocol, or SNMP for short, via the net-snmp npm module. Specifically, I wrote a module export function to create the SNMP session in my snmp.js, which may look like this:
var snmp = require('net-snmp');

module.exports = {
  get: function(caches, host, community, oids) {
    var session = snmp.createSession(host, community, {
      port: 161,
      retries: 1,
      timeout: 2000,
      version: snmp.Version2c
    }).get(oids, function(error, varbinds) {
      log(host + ': Querying...');
      if(!(error)) {
        for(var i in varbinds) {
          var bind = varbinds[i];
          if(!(snmp.isVarbindError(bind))) {
            // Handle logic here
          } else {
            err(host + ': ' + snmp.varbindError(bind));
          }
        }
      } else {
        err(host + ': Query failed - ' + error);
        if(caches[host].version !== 'unknown') {
          caches[host].version = 'unknown';
          log(host + ': Cache updated version to unknown');
        } else {
          log(host + ': Cache already updated');
        }
      }
      if(error !== 'Error: Socket forcibly closed') {
        try {
          session.close();
        } catch(e) {
          err(host + ': Failed to close session');
        }
      }
    });
  }
}
Note that while SNMPv3 is preferable to prior versions of SNMP due to its additional authentication and encryption protocols, at this time in 2017 net-snmp did not yet support SNMPv3 and we had not yet made the switch from v2c to v3 at the company either. This is why I implemented snmp.js with v2c.
My third module, db.js, reads in firewall names and latitude and longitude values to memory using require('fs') and continuously runs SNMP queries, which looks something like this:
var fs = require('fs');

module.exports = {
  // Reads in list of firewalls into memory
  read: function(caches) {
    log('Caching...');
    function firewall(position, version, location) {
      this.position = position;
      this.version = version;
      this.location = location;
    }
    var lines = fs.readFileSync('./db/db.txt').toString().split('\n');
    for(var i in lines) {
      var line = lines[i].trim();
      if(line !== '' && line !== null && line.charAt(0) !== '#') {
        var tokens = line.split('^');
        var coordinates = tokens[1].trim().split(',');
        caches[tokens[0].trim()] = new firewall(
          { lat: parseFloat(coordinates[0].trim()), lng: parseFloat(coordinates[1].trim()) },
          null,
          null
        );
      }
    }
    log('Cached ' + Object.keys(caches).length + ' objects');
    setInterval(function() {
      if(!(querying)) {
        runQueryTask(caches);
      }
    }, delay * 2);
  },
  // Reads current version into memory
  getCurrentVersion: function() {
    var currentVersion = fs.readFileSync('./db/current_version.txt').toString().trim().split('\n')[0].trim();
    log('Current version: ' + currentVersion);
    return currentVersion;
  }
}

// Recursive function to continuously run SNMP queries
function runQueryTask(caches) {
  log('Starting query task...');
  querying = true;
  var cis = [];
  for(var ci in caches) {
    cis.push(ci);
  }
  var i = 0;
  function query() {
    snmp.get(caches, cis[i], globals.community_string, [
      globals.version_oid,
      globals.syslocation_oid
    ]);
    i++;
    i < cis.length ? setTimeout(query, delay) : querying = false;
  }
  query();
}
To run the app, the command is literally just node app which tells Node.js to run app.js, my entry point module. Adding the following to app.js utilizes db.js, which in turn uses snmp.js as shown above:
// Read in list of firewalls/current version and begin querying
db.read(caches);
currentVersion = db.getCurrentVersion();
And to “emit” data from the server to the client, I have an emitData() function:
function emitData(socket, data, fileData) {
  if(fileData !== null && fileData.length !== 0) {
    socket.emit('get_' + data, fileData);
  } else {
    log('Cannot retrieve data, file data was empty');
  }
}
Finally, I needed to develop my frontend as mentioned earlier. This was relatively simple to implement, and looks something like this:
<!DOCTYPE html>
<head>
  <title>Firewall Version Map</title>
  <link rel="shortcut icon" type="image/png" href="img/favicon.ico">
  <link rel="stylesheet" type="text/css" href="css/index.css">
  <script src="js/index.js"></script>
  <script src="js/overlapping_marker_spiderfier.js"></script>
  <script src="socket.io/socket.io.js"></script>
  <script src="js/socket.js"></script>
  <script src="js/index_socket.js"></script>
  <script src="js/index_socket_functions.js"></script>
  <script async defer src="https://maps.googleapis.com/maps/api/js?key=key&callback=init"></script>
  <meta charset="utf-8">
  <meta name="description" content="">
  <meta name="viewport" content="">
</head>
<body>
  <div id="page_container">
    <div id="map"></div>
    <div id="counter"></div>
    <div id="scrollbar"></div>
  </div>
</body>
</html>
The map div holds the Google Maps reference, counter contains metrics for firewall assets (e.g. up to date, one version behind, outdated, unknown/no response etc.), and the scrollbar is a list of all firewalls in a side bar. With some CSS, I was able to add color and other minor styling:
#page_container {
  font-family: Futura-Thin;
  font-weight: 900;
  height: 100%;
  overflow: hidden;
  text-shadow: none;
  width: 100%;
}

#map {
  bottom: 0;
  height: 100%;
  left: 0;
  position: absolute;
  right: 0;
  top: 0;
  width: 85%;
}

#counter {
  background-color: lightgray;
  bottom: 5%;
  height: 2%;
  left: 32.5%;
  overflow: hidden;
  position: absolute;
  right: 50%;
  white-space: nowrap;
  width: 20%;
}

#counter > div {
  display: inline-block;
  height: 100%;
  text-align: center;
  width: 20%;
}

#scrollbar {
  bottom: 0;
  height: 100%;
  left: 85%;
  overflow-y: scroll;
  position: absolute;
  top: 0;
  width: 15%;
}

#scrollbar > div {
  border-style: solid;
  border-width: 1px 0px 0px 0px;
  cursor: pointer;
  height: 4%;
  overflow: hidden;
}

#scrollbar > div:hover {
  background-color: lightgray !important;
}

#scrollbar > div:active {
  background-color: gray !important;
  cursor: pointer;
}

#scrollbar > div:last-child {
  border-width: 1px 0px 1px 0px;
}

@font-face {
  font-family: 'Futura-Thin';
  src: url('/fonts/futura/Futura-Thin.ttf.woff');
}
Since this project is predominantly written in JavaScript, it should be of no surprise that the frontend logic is also written in JavaScript. The following demonstrates the client functions used to communicate with the server and the functionality to add markers to the map:
function getSocket() {
  return (socket !== null) ? socket : io.connect({transports: ['polling']});
}

// Ask server for current version
(function() {
  getSocket().emit('get', 'version');
})();

// Ask server for firewall version data continuously
window.onload = function() {
  (function getCachesTask() {
    getSocket().emit('get', 'caches');
    setTimeout(getCachesTask, 60000);
  })();
}

// When client receives current version from server
socket.on('get_version', function(data) {
  console.log('Client \'got\': version');
  // When client gets version, send acknowledgement back to server
  socket.emit('got', 'version');
  currentVersion = data;
});

// When client receives caches from server
socket.on('get_caches', function(data) {
  console.log('Client \'got\': caches');
  // When client gets caches, send acknowledgement back to server
  socket.emit('got', 'caches');
  // Add markers to map
  firewalls = data;
  addMarkers(firewalls);
});

// Add markers
function addMarkers() {
  for(var ci in firewalls) {
    var firewall = firewalls[ci];
    var position = firewall.position;
    if((!(position)) || position === null) {
      continue;
    }
    var version = firewall.version;
    if((!(version)) || version === '' || version === null) {
      continue;
    }
    var content = ci + ': ' + version;
    var location = firewall.location;
    if(location && location !== '' && location !== 'Unknown' && location !== null) {
      content = '<div>' + content + '<br>' + location + '</div>';
    }
    // Remove current marker for current CI if it exists on map
    var animation = (!(removeMarker(ci))) ? google.maps.Animation.DROP : null;
    addMarker({
      ci: ci,
      position: position,
      icon: getIcon(version, currentVersion),
      content: content,
      animation: animation
    });
  }
}
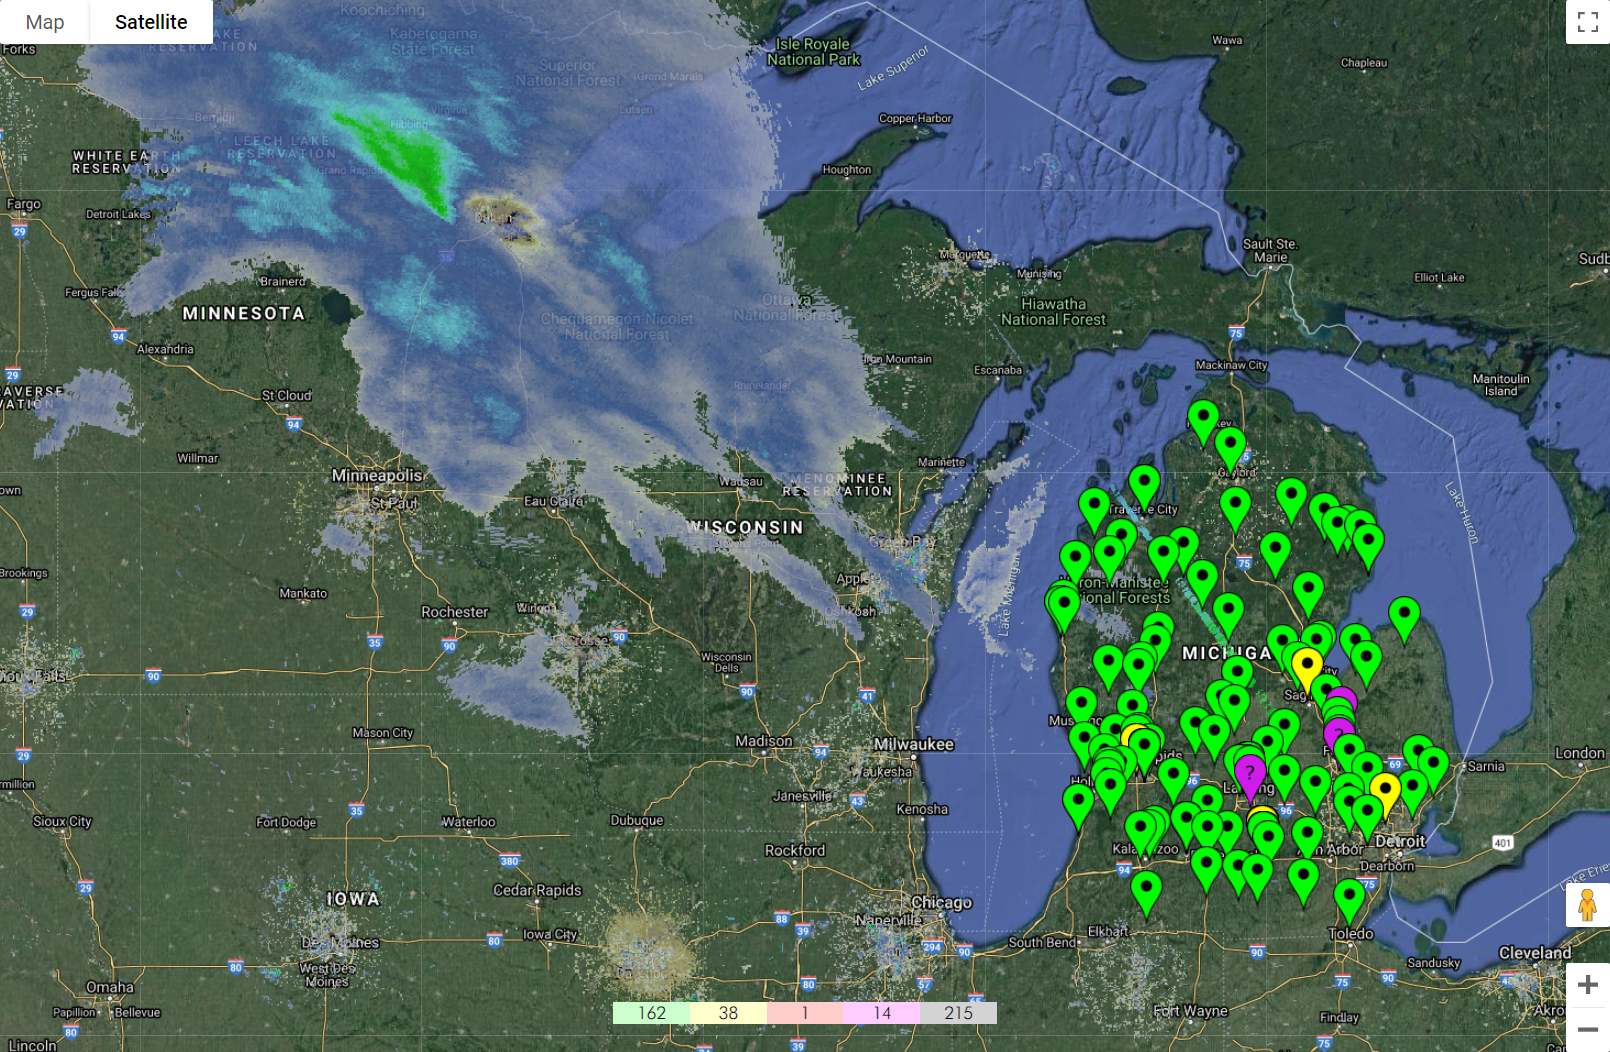
At this point, I had met all requirements (prior to iteration 2, which would come years later). Hosting the project on my internal scripting server, I started the application with node app, watched the geolocation data caching and SNMP queries begin, and browsed to my server’s IP address on port 3000. The page loaded, and I started seeing colored markers populating all over the state, indicating the following:
- Green - up to date
- Yellow - one version behind
- Red - outdated version
- Purple - unknown status
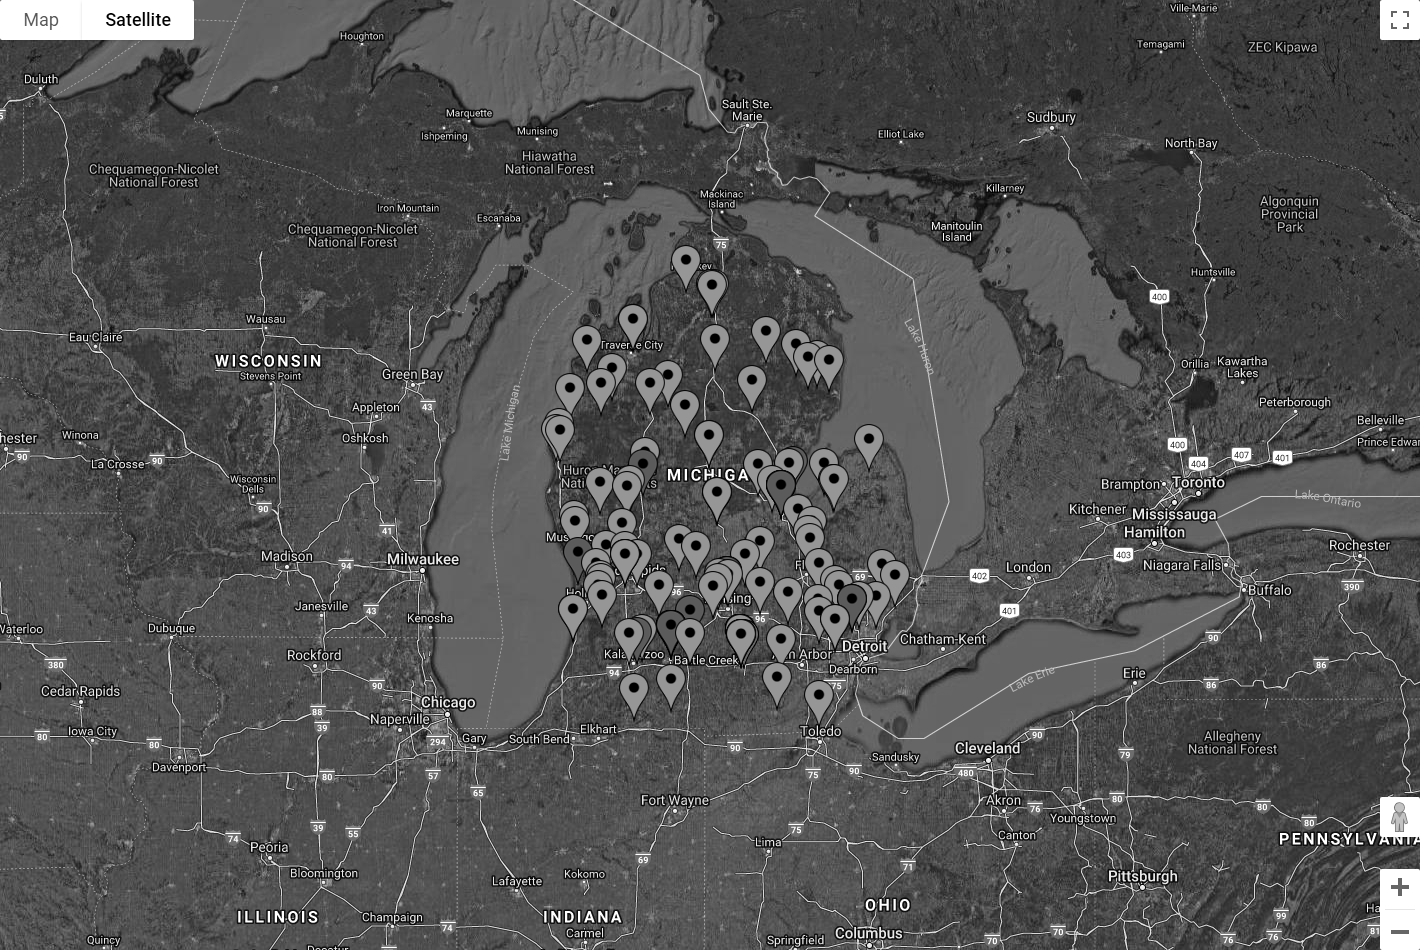
Due to security concerns, I am unable to share site names or other detailed information (e.g. PanOS versions, asset naming conventions, etc.) shown in the web interface. Nonetheless the above photo demonstrates my results with the completion of the first iteration of this project.
Iteration 2
Aside from some minor tweaking over the years, my Firewall Version Map was proven useful for reporting out metrics on our weekly operations conference calls. We were able to watch in real-time as sites were upgraded for any particular version rollout - it was satisfying to watch the markers turn from red to green, indicating a strong sense of security and maintainability to upper-management. At the very least, this was the case until early 2020.
At some point in mid-2018, I was contacted by one of our network security engineers to find a way to plot per-core historical CPU performance data of the dataplane of all of our firewalls. As it turned out, there was no “built-in” way to do so, even with the Panorama management service for the platform, which only showed a computed average across all cores for both the management plane and dataplane of all connected assets. And even then, it did not show enough historical data, which would be extremely useful for comparing timestamps in incident tickets and triaging network-related events at the company.
Interestingly enough, Palo Alto firewalls do provide real-time per-core CPU performance metrics, but they do not graph them. It is also not possible to retrieve these per-core metrics with SNMP, as there are no OIDs associated at that level - only the computed averages can be retrieved with SNMP. It is possible to use the CLI and see these metrics, but the visibility is very limited to the human eye. It is also possible to use the provided XML API, which would make the most sense for an integrated service or an “in-house” developed solution (this is what I would use in 2020).
I had tried to set up a polling service against the provided XML API with Cacti, a common network graphing solution we had already installed for other purposes, but was unable to get it working to my satisfaction. Since this was only requested by one other team member, and I had made other commitments to other projects, this was deemed low priority.
As a result of the “work from home” requirements going into effect, this idea became high priority in March of 2020. Naturally, skepticism of network performance rose as everyone went remote, especially of our VPN utilization. At some point, I was told to prioritize the idea above all other objectives due to the criticality of the unprecedented situation we were watching unfold at the company and in the world. So I got to work.
Originally, I envisioned the following additions:
cpu.js- Palo Alto XML API poller and response parser./data/- data directory for historical CPU performance./frontend/public/cpu.html- client web page to show plotted data
Much like snmp.js, cpu.js would spin up its own thread and continuously poll all the firewalls for data and log it to the ./data/ directory:
var concat = require('concat-stream');
var fs = require('fs');
var https = require('https');
var xml2js = require('xml2js');
var parser = xml2js.Parser();

// Request API key
function getKey(ci, callback) {
  log('Requesting XML API key from ' + ci + '...');
  https.get('https://' + ci + '/api/?type=keygen&user=' + globals.xml_api_username + '&password=' + globals.xml_api_password, function(response) {
    response.on('error', function(error) {
      err('Error while reading response: ' + error);
    });
    response.pipe(concat(function(buffer) {
      parser.parseString(buffer.toString(), function(error, result) {
        var key = result['response']['result'][0]['key'][0];
        log(ci + ': Key: ' + key);
        this.key = key;
        callback(key);
      });
    }));
  }).on('error', (error) => {
    err('HTTPS request error: ' + error);
  });
}

// Request CPU data
function getCores(ci, key = globals.xml_api_key) {
  log(ci + ': Polling...');
  https.get('https://' + ci + '/api/?type=op&cmd=<show><running><resource-monitor><second></second></resource-monitor></running></show>&key='
      + (key !== null ? key : globals.xml_api_key), function(response) {
    response.on('error', function(error) {
      err('Error while reading response: ' + error);
    });
    var code = response.statusCode;
    log(ci + ': Response: ' + code);
    if(code !== 200) {
      return;
    }
    response.pipe(concat(function(buffer) {
      parser.parseString(buffer.toString(), function(error, result) {
        if(error) {
          err(ci + ': HTTPS parsing error (#1): ' + error);
          return;
        }
        var dp = null;
        try {
          dp = result['response']['result'][0]['resource-monitor'][0]['data-processors'];
        } catch(e) {
          err(ci + ': HTTPS parsing error (#2): ' + e);
          return;
        }
        if(dp === null) {
          err(ci + ': HTTPS parsing error (#3)');
          return;
        }
        var dp0 = null;
        for(var i = 0; i < dp.length; i++) {
          var dps = Object.keys(dp[i]);
          for(var j = 0; j < dps.length; j++) {
            var s = dps[j];
            if(s.includes('dp0')) {
              dp0 = s;
              log(ci + ': Found dataplane identifier: ' + s);
              break;
            }
          }
        }
        if(dp0 === null) {
          err(ci + ': Failed to find dataplane identifier');
          return;
        }
        var cores = dp[0][dp0][0]['second'][0]['cpu-load-average'][0]['entry'];
        var cpuData = './data/cpu/';
        if(!(fs.existsSync(cpuData))) {
          fs.mkdirSync(cpuData);
        }
        if(!(fs.existsSync(cpuData))) {
          err(ci + ': Failed to create data directory: ' + cpuData);
          return;
        }
        var data = (new Date()).toISOString() + '^';
        for(var i = 0; i < cores.length; i++) {
          var core = cores[i];
          data += core['coreid'] + ':' + core['value'].toString().split(',')[0] + (i === (cores.length - 1) ? '' : ' ');
        }
        log(ci + ': ' + data);
        data += '\n';
        fs.appendFileSync(cpuData + ci + '.dat', data);
      });
    }));
  }).on('error', (error) => {
    err(ci + ': HTTPS request error: ' + error);
  });
}

// Caller function to begin polling
module.exports = {
  poll: function(caches) {
    setInterval(function() {
      if(!(polling)) {
        runPollTask(caches);
      }
    }, delay * 5);
  }
}

// Recursive function to continuously run XML API polls
function runPollTask(caches) {
  log('Starting poller task...');
  polling = true;
  var cis = [];
  for(var ci in caches) {
    cis.push(ci);
  }
  var i = 0;
  function poll() {
    getCores(cis[i]);
    i++;
    i < cis.length ? setTimeout(poll, delay) : polling = false;
  }
  poll();
}
This code produces output in DATETIME^CORE0:VALUE0 CORE1:VALUE1 CORE2:VALUE2 ... format, with each line being a timestamp in UTC time and percent core utilization for every core in the firewall’s dataplane. For example, the following 10 lines contain data for 10 polls, separated by roughly 4-5 minutes, generating 6 * 10 = 60 data points over an approximate 40 minute window for only one asset:
2020-02-28T18:47:57.470Z^0:0 1:15 2:22 3:21 4:22 5:21
2020-02-28T18:52:26.240Z^0:0 1:16 2:22 3:22 4:22 5:22
2020-02-28T18:56:55.060Z^0:0 1:20 2:29 3:28 4:29 5:29
2020-02-28T19:01:23.800Z^0:0 1:17 2:23 3:23 4:23 5:24
2020-02-28T19:05:52.579Z^0:0 1:17 2:23 3:24 4:23 5:23
2020-02-28T19:10:21.362Z^0:0 1:17 2:22 3:22 4:22 5:22
2020-02-28T19:14:50.139Z^0:0 1:19 2:27 3:27 4:27 5:27
2020-02-28T19:19:18.910Z^0:0 1:21 2:33 3:33 4:32 5:33
2020-02-28T19:23:47.699Z^0:0 1:17 2:23 3:23 4:23 5:23
2020-02-28T19:28:16.471Z^0:0 1:16 2:24 3:24 4:24 5:24
This was a feat in itself, even if I had no way to graph it. I would still be able to provide the data upon request, but visualizing it would still be impossible without some sort of plotting solution. I investigated a few options, but ultimately decided to implement the D3.js JavaScript library, likely the most powerful data manipulation and SVG path visualization resource available for web-based projects.
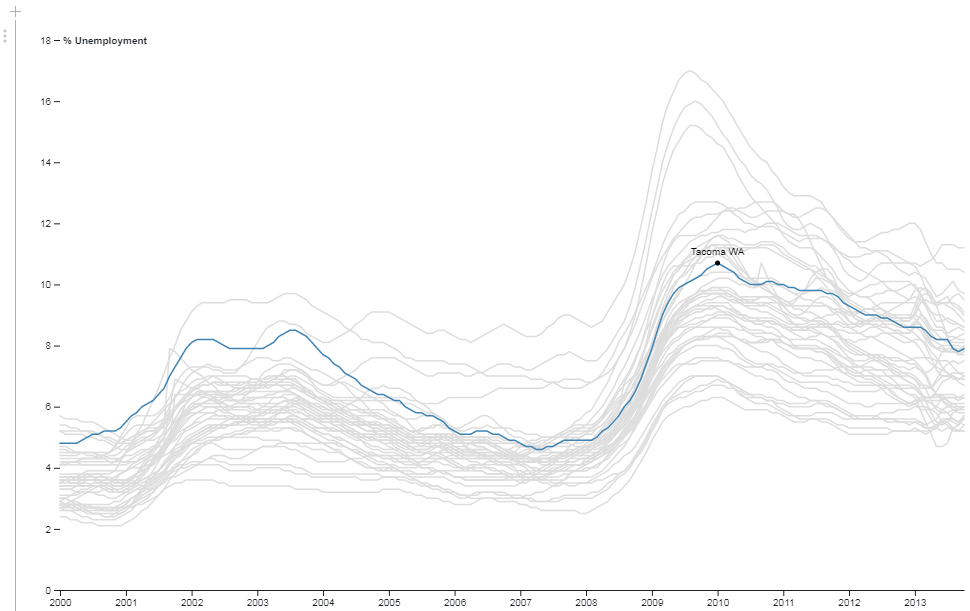
Adding D3 to my frontend was easy, but writing the code for the chart was a bit more challenging. I had quickly decided to go with a multi-line chart after looking at the D3 examples gallery under the assumption that I could plot each core on the same chart and highlight an individual core using hover events as seen in the example:
Reading in the CPU data to memory in the backend would be trivial. I only had to add some code to my switch(data) statement in app.js along with a function to read the data:
var ci = null;
if(data.includes('cpu_data')) {
  var d = data.split('_');
  ci = d[d.length - 1];
  data = 'cpu_data';
}
switch(data) {
  // ...
  case 'cpu_data':
    if(ci === null) {
      log('Cannot retrieve CPU data, ci is null');
      break;
    }
    emitData(socket, data, getData('./data/cpu/' + ci + '.dat'));
    break;
  default:
    log('Unknown data requested by client: ' + data);
    break;
}
function getData(file) {
  if(!(fs.existsSync(file))) {
    log('Cannot retrieve data file - ' + file + ' does not exist');
    return null;
  }
  var data = {};
  var lines = fs.readFileSync(file).toString().split('\n');
  var dataLines = lines.length;
  if(dataLines > maxDataLines) {
    dataLines = maxDataLines;
  }
  for(var i = (lines.length - dataLines); i < (lines.length - 1); i++) {
    var line = lines[i];
    if(line === null || line == '') {
      continue;
    }
    var tokens = line.trim().split('^');
      data[new Date(tokens[0])] = tokens[1];
    }
    return data;
}
After much trial and error to get the graph working, I finally struck success after figuring out how D3 expects data to be formatted for its charts. Indeed, the code implemented on the frontend was once again written in JavaScript, but in a quite “CSS-like” builder fashion:
var socket = getSocket();

var cpuData;
const color = 'steelblue';

// When client receives CPU data from server
socket.on('get_cpu_data', function(data) {
  console.log('Client \'got\': cpu_data');
  // When client gets CPU data, send acknowledgement back to server
  socket.emit('got', 'cpu_data');
  cpuData = data;
  drawLineChart();
});

// Draw line chart
function drawLineChart() {
  d3.selectAll('svg > *').remove();
  // Array of data
  var series = [];
  var dates = Object.keys(cpuData);
  // For each core
  for(var i = 0; i < cpuData[new Date(dates[0])].trim().split(' ').length; i++) {
    var data = [];
    // For each line
    for(var j = 0; j < dates.length; j++) {
      var d = new Date(dates[j]);
      data.push({
        date: d,
        value: +cpuData[d].trim().split(' ')[i].trim().split(':')[1]
      });
    }
    series.push({
      core: i,
      data: data
    });
  }
  var svgHeight = 950;
  var svgWidth = 1500;
  var margin = {
    bottom: 30,
    left: 50,
    right: 30,
    top: 20
  };
  var height = svgHeight - margin.top - margin.bottom;
  var width = svgWidth - margin.left - margin.right;
  var svg = d3.select('svg')
    .attr('height', svgHeight)
    .attr('width', svgWidth)
    .append('g')
    .attr('transform', 'translate(' + margin.left + ', ' + margin.top + ')');
  var xScale = d3.scaleTime()
    .domain(d3.extent(series[0].data, d => d.date))
    .range([0, width]);
  var max = 0;
  for(var i = 0; i < series.length; i++) {
    var data = series[i];
    for(var j = 0; j < data.data.length; j++) {
      var value = data.data[j].value;
      if(value > max) {
        max = value;
      }
    }
  }
  var yScale = d3.scaleLinear()
    .domain([0, Math.min(max + Math.round(max * 1.25), 100)])
    .range([height, 0]);
  var xAxis = d3.axisBottom(xScale);
  var yAxis = d3.axisLeft(yScale);
  var xSvg = svg.append('g')
    .call(xAxis)
    .attr('class', 'x axis')
    .attr('transform', 'translate(0, ' + height + ')');
  svg.append('g')
    .call(yAxis)
    .append('text')
    .attr('class', 'y axis')
    .attr('dy', '0.70em')
    .attr('fill', '#000')
    .attr('text-anchor', 'start')
    .attr('transform', 'translate(5, 0)')
    .attr('y', 5)
    .text('CPU Core Utilization %');
  svg.append('g')
    .attr('class', 'grid')
    .call(d3.axisLeft(yScale)
      .tickSize(-width)
      .tickFormat('')
    );
  svg.append('text')
    .attr("x", (width / 2))
    .attr("y", 0 - (margin.top / 2) + 30)
    .attr("text-anchor", "middle")
    .style("font-size", "24px")
    .style("text-decoration", "underline")
    .text(document.title + ' (dp0)');
  var brush = d3.brushX()
    .extent([[0, 0], [width, height]])
    .on('end', updateChart);
  var line = d3.line()
    .curve(d3.curveBasis)
    .x(d => xScale(d.date))
    .y(d => yScale(d.value));
  var idleTimeout = 0;
  function idled() {
    idleTimeout = null;
  }
  function updateChart() {
    var extent = d3.event.selection;
    if(!(extent)) {
      if(!(idleTimeout)) {
        return idleTimeout = setTimeout(idled, 350);
      }
    } else {
      xScale.domain([xScale.invert(extent[0]), xScale.invert(extent[1])]);
      b.call(brush.move, null);
    }
    xSvg
      .transition()
      .duration(1000)
      .call(d3.axisBottom(xScale));
    lines.selectAll('.line-group > .line')
      .transition()
      .duration(1000)
      .attr('d', d => line(d.data));
    }
    svg.on('dblclick', function() {
      xScale.domain(d3.extent(series[0].data, d => d.date));
      xSvg
        .transition()
        .call(d3.axisBottom(xScale));
      lines.selectAll('.line-group > .line')
        .transition()
        .duration(1000)
        .attr('d', d => line(d.data));
    });
    var clip = svg.append('defs').append('svg:clipPath')
      .attr('id', 'clip')
      .append('svg:rect')
      .attr('height', height)
      .attr('width', width);
    var l = svg.append('g')
      .attr('clip-path', 'url(#clip)');
    var b = l.append('g')
      .attr('class', 'brush')
      .call(brush);
    var lines = l.append('g')
      .attr('class', 'lines')
      .on('mouseenter', function(d) {
        d3.selectAll('.line-group > *')
          .style('stroke', 'lightgray');
      })
      .on('mouseleave', function(d) {
        d3.selectAll('.line-group > *')
          .style('stroke', color);
      });
    lines.selectAll('.line-group')
      .data(series)
      .enter()
      .append('g')
      .attr('id', function(d) {
        return 'core-' + d.core + '-line';
      })
      .attr('class', 'line-group')
      .on('mouseenter', function(d) {
        svg.append('text')
          .attr('class', 'title-text')
          .style('fill', color)
          .text('Core ' + d.core)
          .attr('text-anchor', 'middle')
          .attr('x', width / 2)
          .attr('y', height / 6)
      })
      .on('mouseleave', function(d) {
        svg.select('.title-text').remove();
      })
      .append('path')
      .attr('class', 'line')
      .attr('d', d => line(d.data))
      .attr('fill', 'none')
      .style('stroke', color)
      .style('stroke-linecap', 'round')
      .style('stroke-linejoin', 'round')
      .style('stroke-width', 1.5)
      .on('mousemove', function(d) {
        d3.select(this)
          .style('cursor', 'pointer')
          .style('stroke', color)
          .style('stroke-width', 1.75);
      })
      .on('mouseenter', function(d) {
        d3.select(this)
          .transition()
          .duration(250)
          .style('cursor', 'pointer')
          .style('stroke', color)
          .style('stroke-width', 1.75);
      })
      .on('mouseleave', function(d) {
        d3.select(this)
          .style('cursor', 'none')
          .style('stroke', 'lightgray')
          .style('stroke-width', 1.5);
      });
}
Results
In the beginning, we used my charts primarily to monitor dataplane performance and to watch for anomalous behavior on our VPN aggregation firewalls. On multiple occasions, my new visualization resource caught these types of events before our other monitoring solutions were able to send out alerts. We could also now see if specific cores were under more load than other cores, which allowed us to make more well-informed decisions in response.
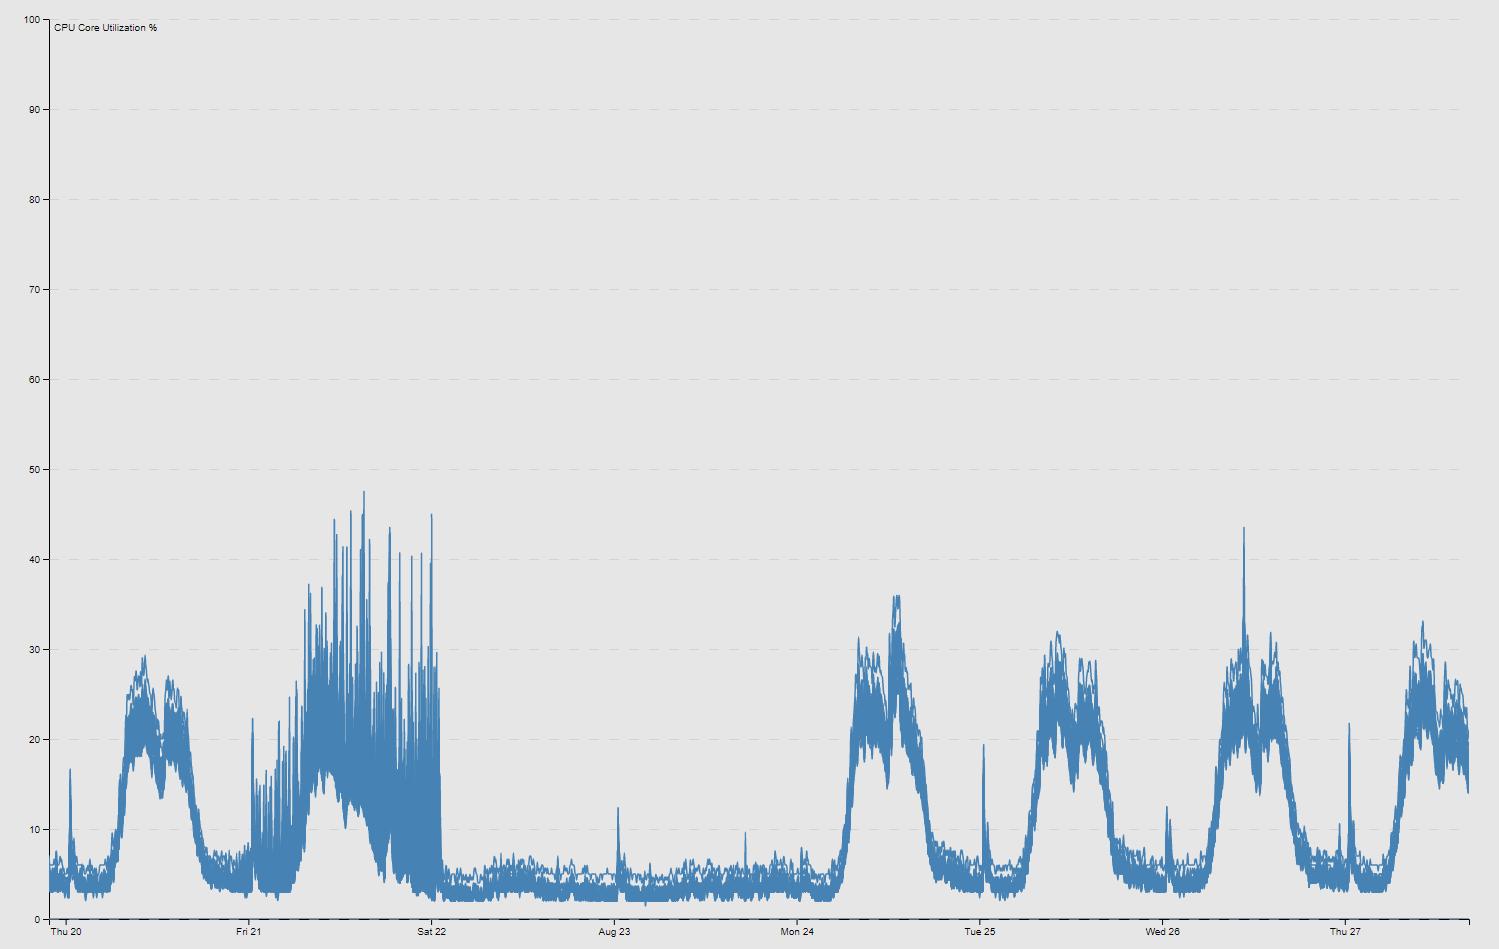
Comparable to the D3 example, my charts may have looked like this:
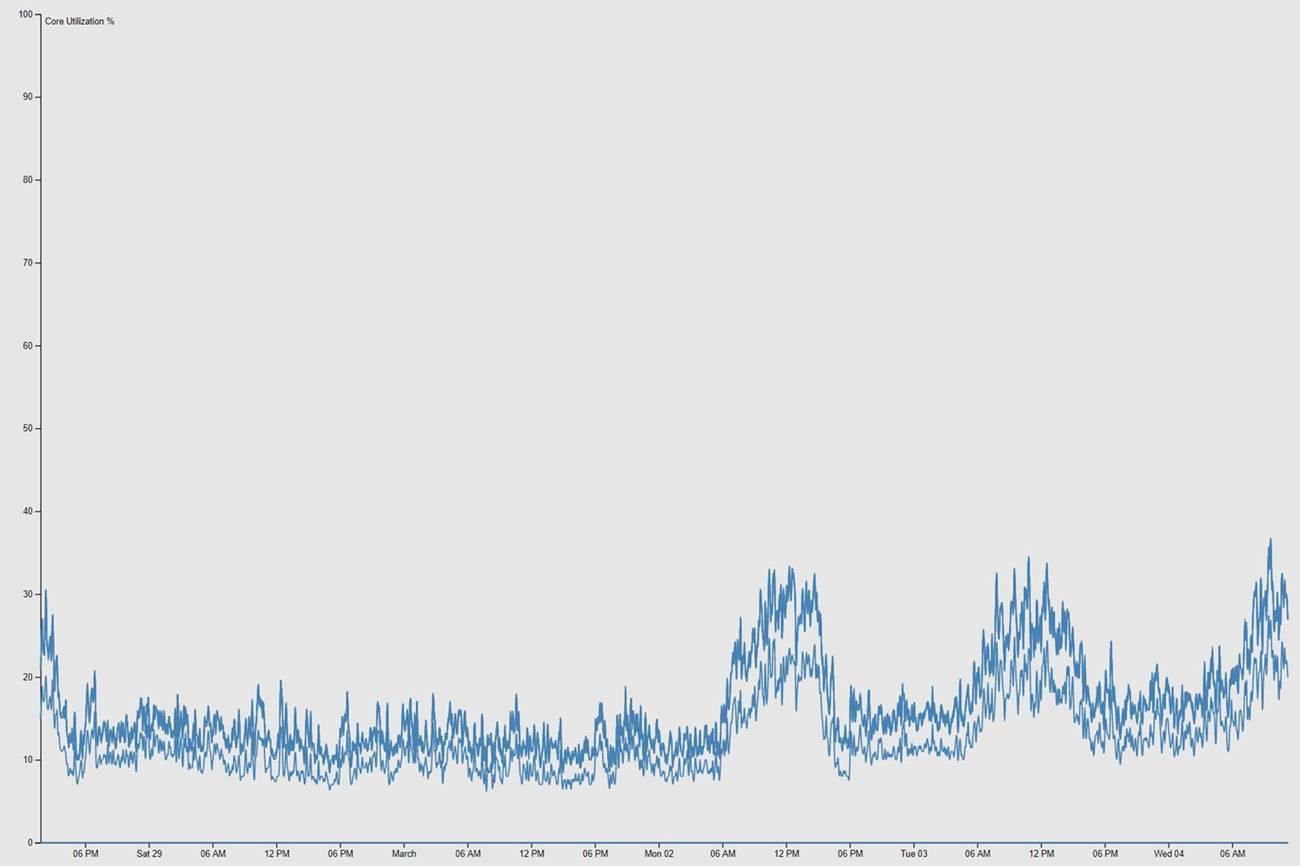
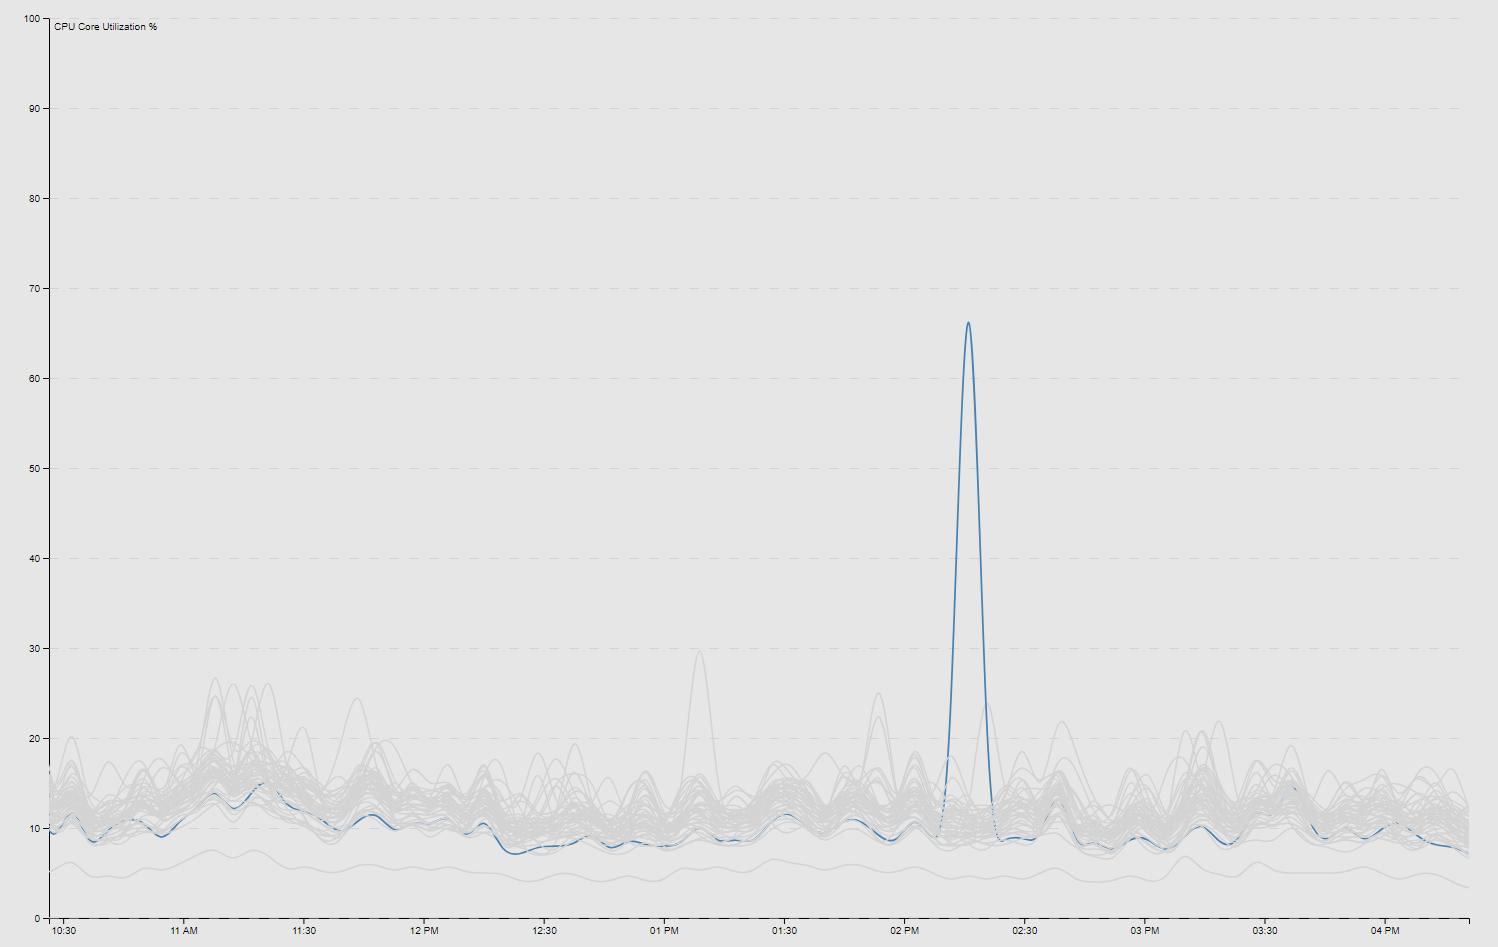
Hovering over any individual line in the chart highlights the specific core (this specific example demonstrates anomalous behavior on one specific core):
After I got the charts working as intended, I also added a zoomable feature by clicking and dragging in case we wanted to scrutinize a specific time window. This was done by adding a clip path (var clip = svg.append('defs').append('svg:clipPath')) as seen in the code example from iteration 2 above. To return to the full data set, I added a dblclick event on the SVG path as also seen above:
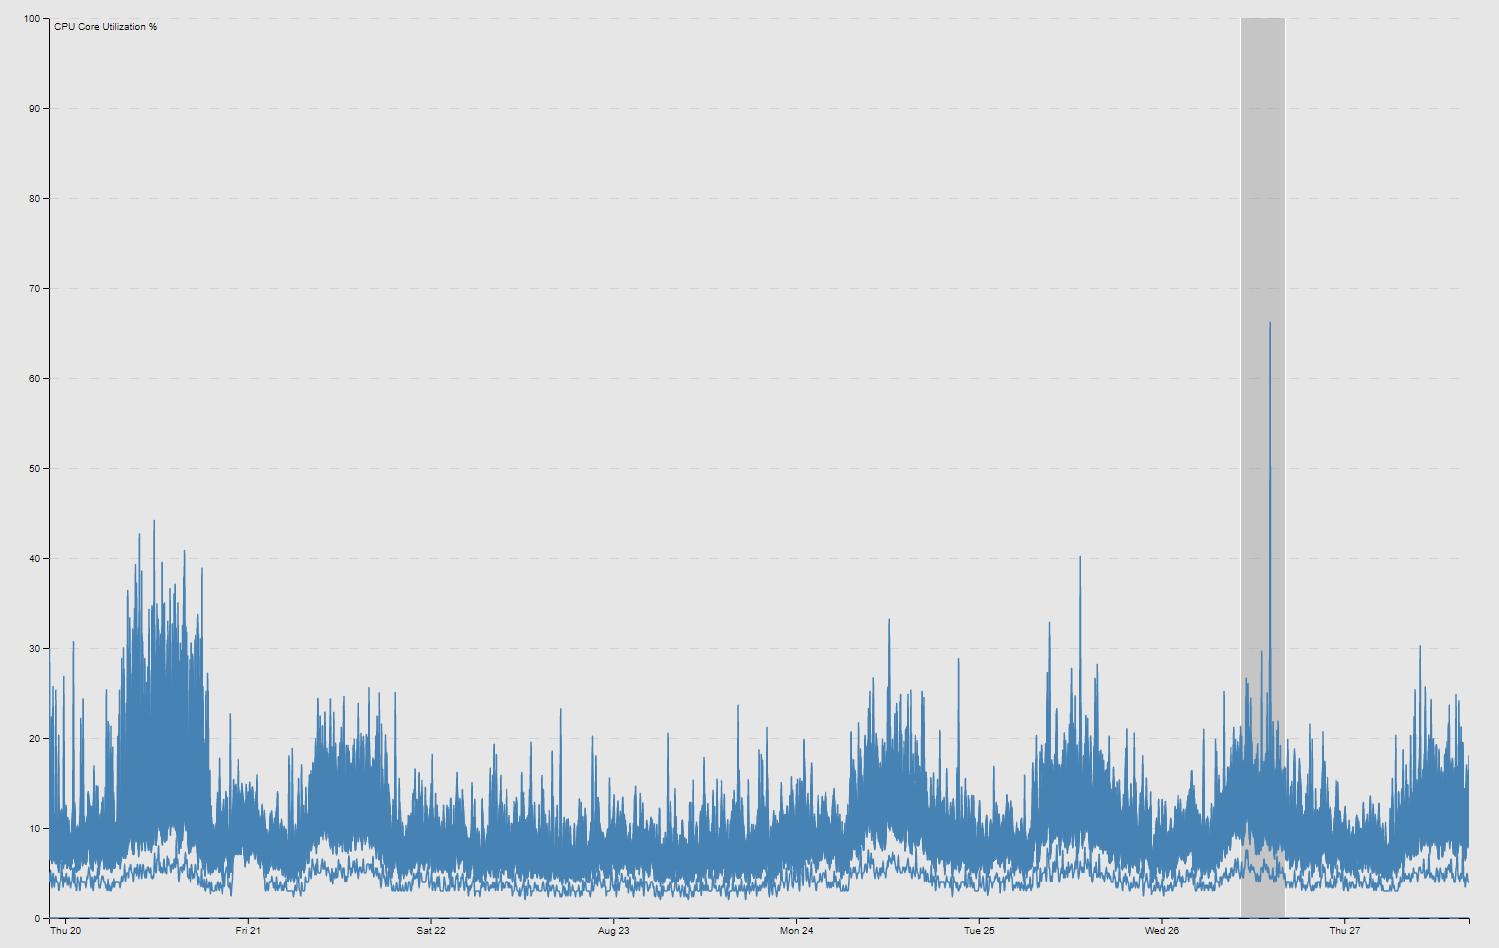
From the updates made in iteration 2, my team now had full historic visibility into the per-core dataplane performance of every deployed firewall across the country. This has been proven vital for our operational needs over the last several months as the company continues to perform its duties from home.
Further considerations to keep in mind include disk space growth over time, given that hundreds of data files are being constantly appended in the project’s ./data/ directory. To monitor some basic statistics, I wrote a simple Bash script:
#!/bin/bash

echo "Log: $(wc -l ./log.txt | grep -o -E "[0-9]+") lines ($(du -sh ./log.txt | grep -o -E "[0-9]+(\.[0-9]+|)[KMG]"))"
echo "Start: $(cat $(ls ./data/cpu/*.dat | head -1 | cut -f11 -d ' ') | head -1 | cut -f1 -d '^')"
echo "Polls: $(wc -l ./data/cpu/*.dat | tail -1 | grep -o -E "[0-9]+") ($(du -sh ./data/cpu/ | grep -o -E "[0-9]+(\.[0-9]+|)[KMG]"))"
echo "Data points: $(grep -o -E "(\^|\ )[0-9]+:[0-9]+" ./data/cpu/*.dat | wc -l)"
I recently reset all the data, but between late February and August 2020, my program had executed just north of 10,000,000 polls and generated over 100,000,000 (yes, that’s 100 million) data points between all the firewalls across the country.
# ./get_cpu_stats.sh
Log: 60259501 lines (4.3G)
Start: 2020-02-28T18:47:27.595Z
Polls: 10351927 (673M)
Data points: 101279840
The insight this project has provided and my satisfaction with the results and everything I learned along the way have been my biggest takeaways in the multiple years I have worked on and revisited my Firewall Version Map. For now, I am labeling this project closed - at least until I receive a request for a third iteration. ![]()
Changelog
Update: Jul 19, 2021 (SNMPv3)
Preliminary steps to support a planned future deployment of SNMPv3 on the Palo Alto platform include adjusting the snmp.js module to poll via SNMPv3, using the authentication and encryption protocols which are not supported in v2c and earlier versioning. For example:
// Default options for v3
var options = {
  port: 161,
  retries: 1,
  timeout: 5000,
  transport: "udp4",
  trapPort: 162,
  version: snmp.Version3,
  engineID: "8000B98380XXXXXXXXXXXXXXXXXXXXXXXX", // where the X's are random hex digits
  idBitsSize: 32,
  context: ""
};

// Example user
var user = {
  name: "blinkybill",
  level: snmp.SecurityLevel.authPriv,
  authProtocol: snmp.AuthProtocols.sha,
  authKey: "madeahash",
  privProtocol: snmp.PrivProtocols.des,
  privKey: "privycouncil"
};

var session = snmp.createV3Session ("127.0.0.1", user, options);
Update: Feb 15, 2022 (Weather)
Mostly out of boredom, I randomly had the idea to add a weather layer overlay on the version map so I could track potential severe storm events and our site locations all in one screen. I usually have an extra tab open to monitor the local radar, since weather events have the capacity to impact the work I perform, so I figured I could build it into my map too. Using mesonet.agron.iastate.edu cache tiles, I added nexrad-n0q-900913 to my init() function and used map.overlayMapTypes.push() to add the tiles to my map:
// Initializes map
function init() {
  map = new google.maps.Map(document.getElementById('map'), {
    center: {
      lat: 43.75,
      lng: -84.75
    },
    mapTypeId: 'hybrid',
    zoom: 7
  });
  oms = new OverlappingMarkerSpiderfier(map, {
    markersWontMove: true,
    markersWontHide: true,
    basicFormatEvents: true
  });
  map.overlayMapTypes.push(
    new google.maps.ImageMapType({
      getTileUrl: function(tile, zoom) {
        return 'https://mesonet.agron.iastate.edu/cache/tile.py/1.0.0/nexrad-n0q-900913/'
          + zoom + '/' + tile.x + '/' + tile.y + '.png?' + (new Date()).getTime();
      },
      opacity: 0.8
    })
  );
}
